
Wearable IoT Gas Meter Development
An in-depth look at the design and prototyping of a full-stack IoT system for first-responder safety.
role
Lead Engineer (Hardware, Firmware & Cloud Design)
technologies
KiCad, nRF9151 (LTE-M), Zephyr RTOS, C/C++, MQTT, OCI, TimescaleDB, Docker, Node.js
1. The challenge
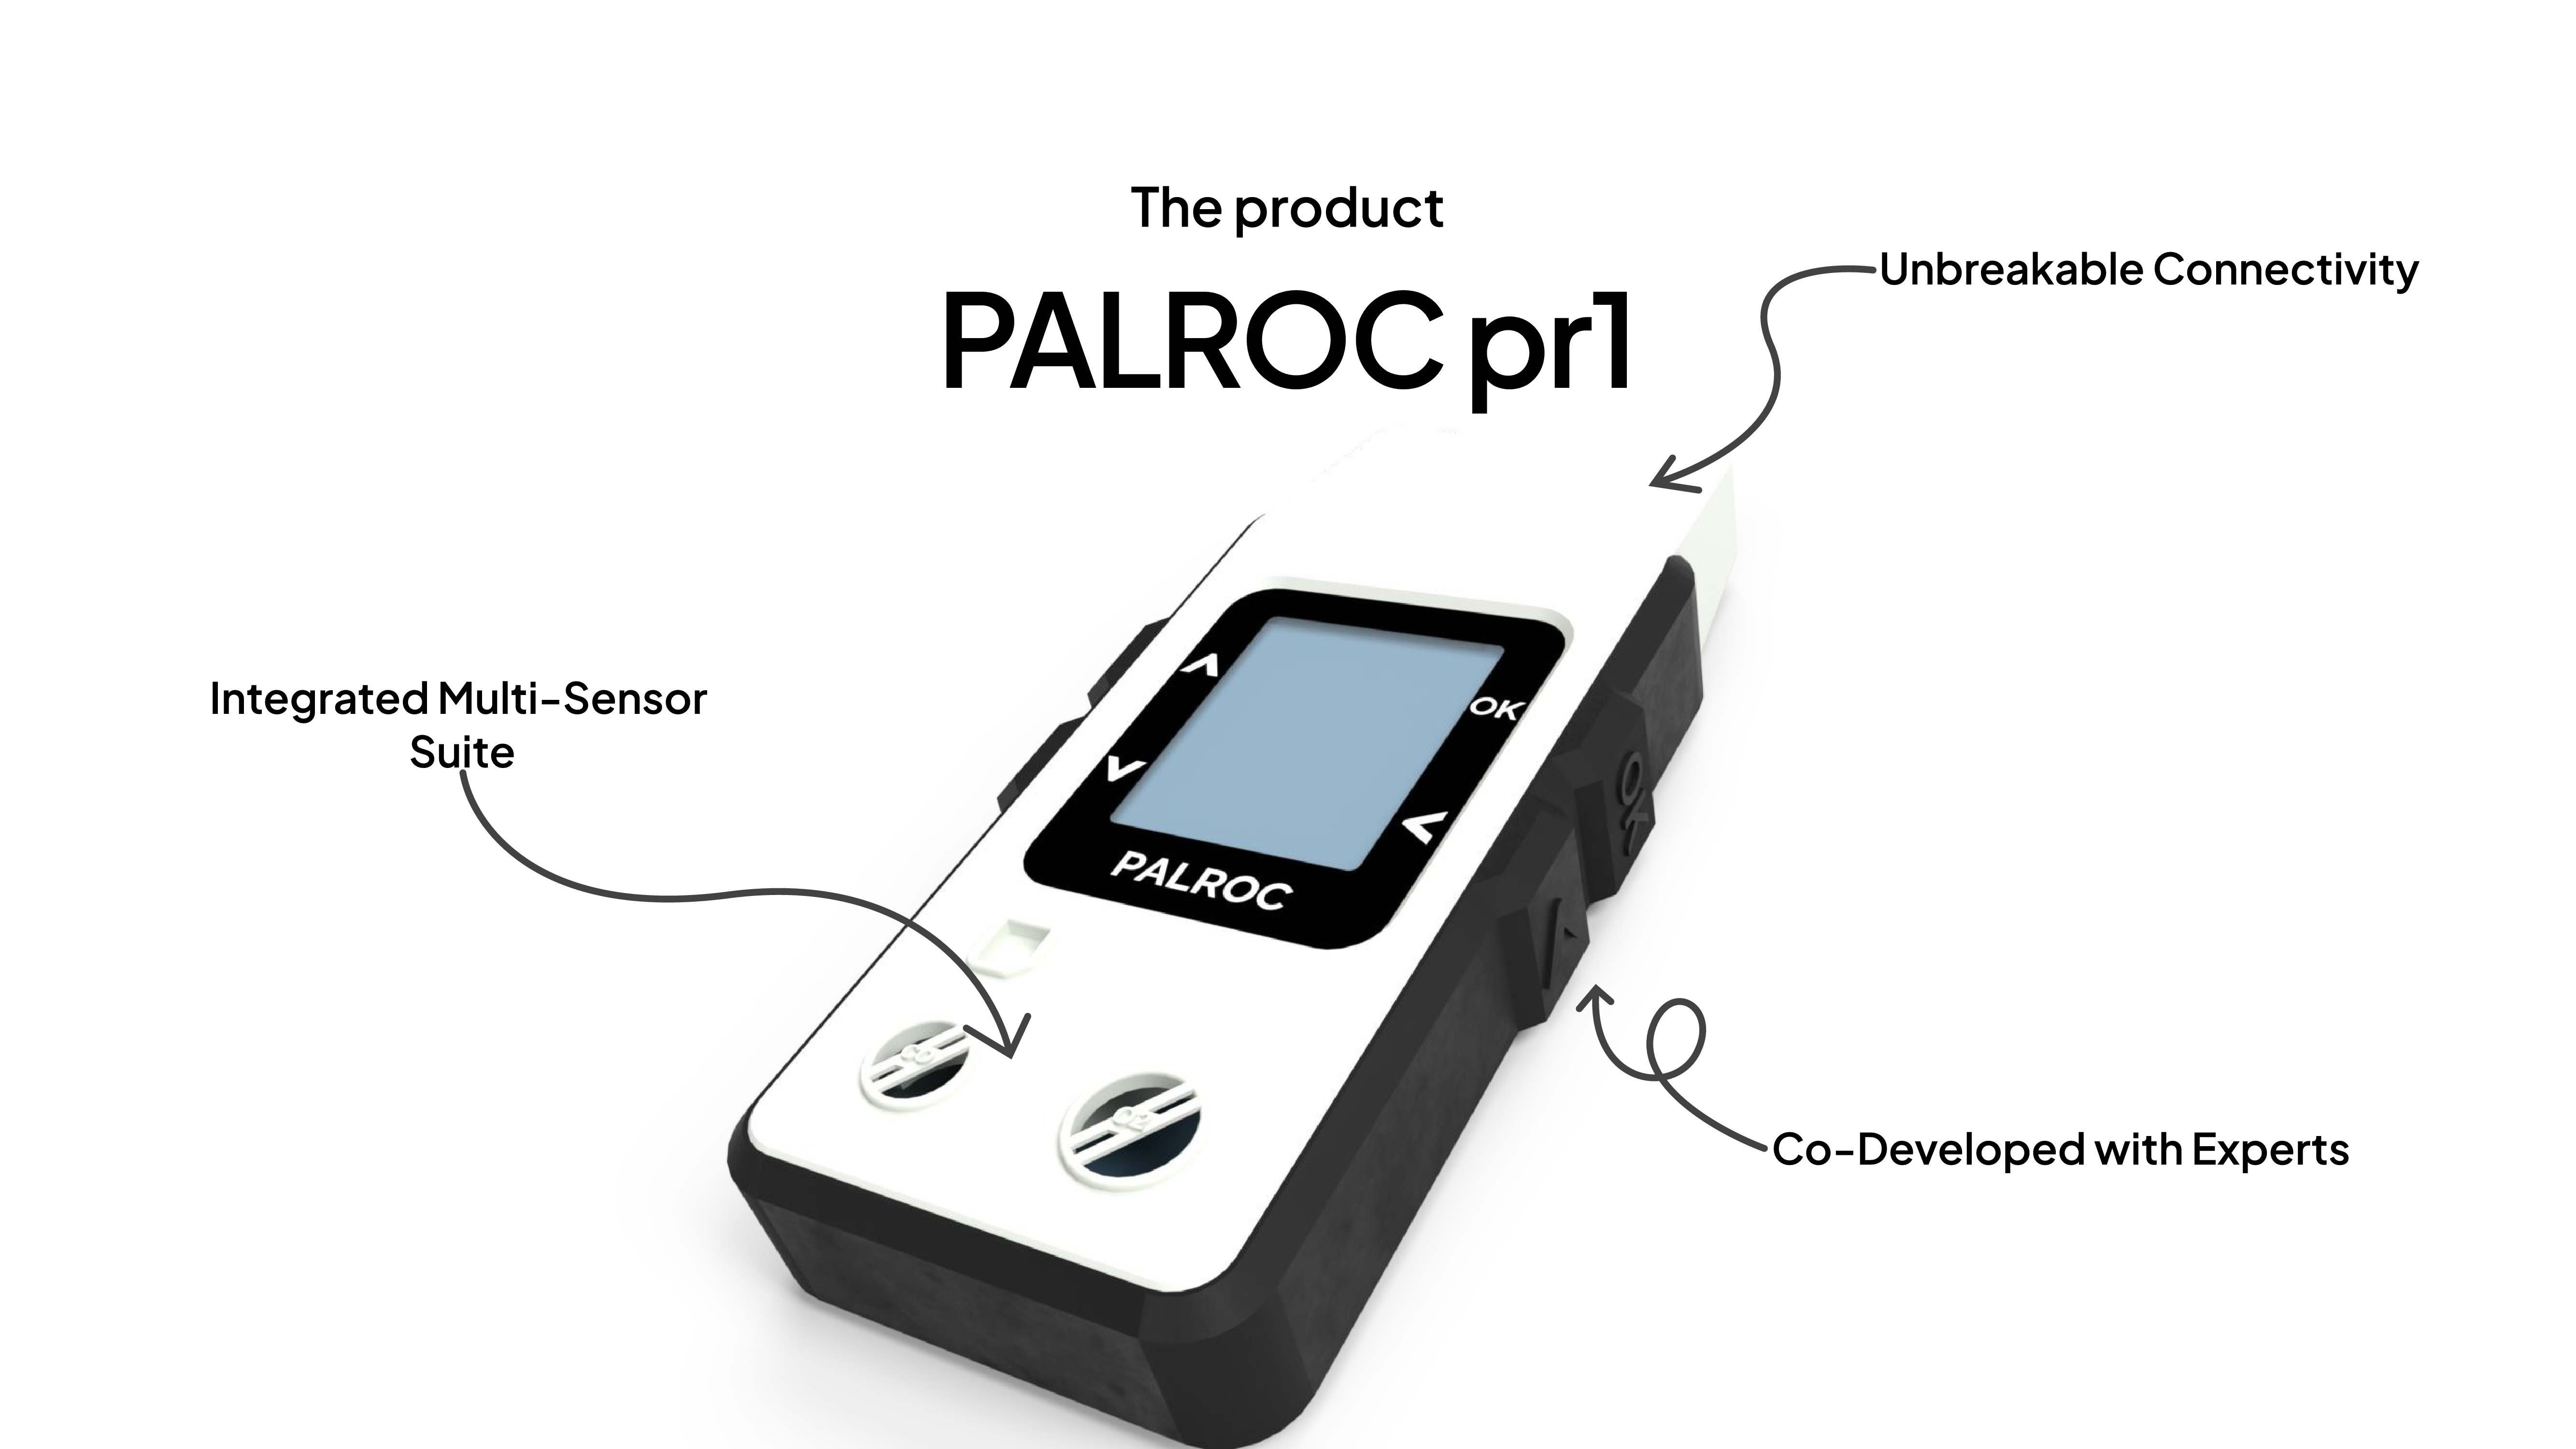
To conceptualize, design, and prototype a complete, end-to-end IoT system from scratch. The goal was a portable, low-power, multi-sensor gas and particle meter to enhance first-responder safety, capable of transmitting real-time data to a cloud platform.
2. My solution
I developed a full-stack prototype demonstrating broad capabilities across the entire IoT technology stack. The solution includes custom hardware design, embedded firmware, and a cloud backend for data visualization.
3. Technical development breakdown
This project spanned four primary technical areas:
3.1. Hardware design & prototyping
The hardware development cycle included:
- Sensor selection (gas, LEL - lower explosive limit, and particulate matter) and the design of schematics and multi-layer PCBs using KiCad.
- Integration of the core processing and communication component: a Nordic Semiconductor nRF9151 SiP (system-in-package), optimized for low-power cellular IoT (LTE-M and GNSS) applications.
- Prototype assembly and initial hardware validation.
3.2. Embedded firmware development
Significant effort was dedicated to the firmware, developed in C/C++ on the Zephyr RTOS. The scope encompassed:
- Interfacing with multiple complex sensors.
- Managing device power states for low-power operation.
- Implementing the LTE-M cellular communication stack, including module control via AT commands.
- Handling data packetization using protocols like MQTT over TCP/IP.
3.3. Cloud backend & data processing
A complete cloud-based data pipeline was architected and deployed:
- Ingestion: Configuring a HiveMQ MQTT broker to receive real-time data from the devices.
- Storage: Utilizing a TimescaleDB time-series database, hosted on Oracle Cloud Infrastructure (OCI).
- Processing: Developing server-side logic within the OCI environment to process, analyze, and potentially trigger alerts based on the incoming sensor readings.
3.4. Frontend (dashboard) & DevOps
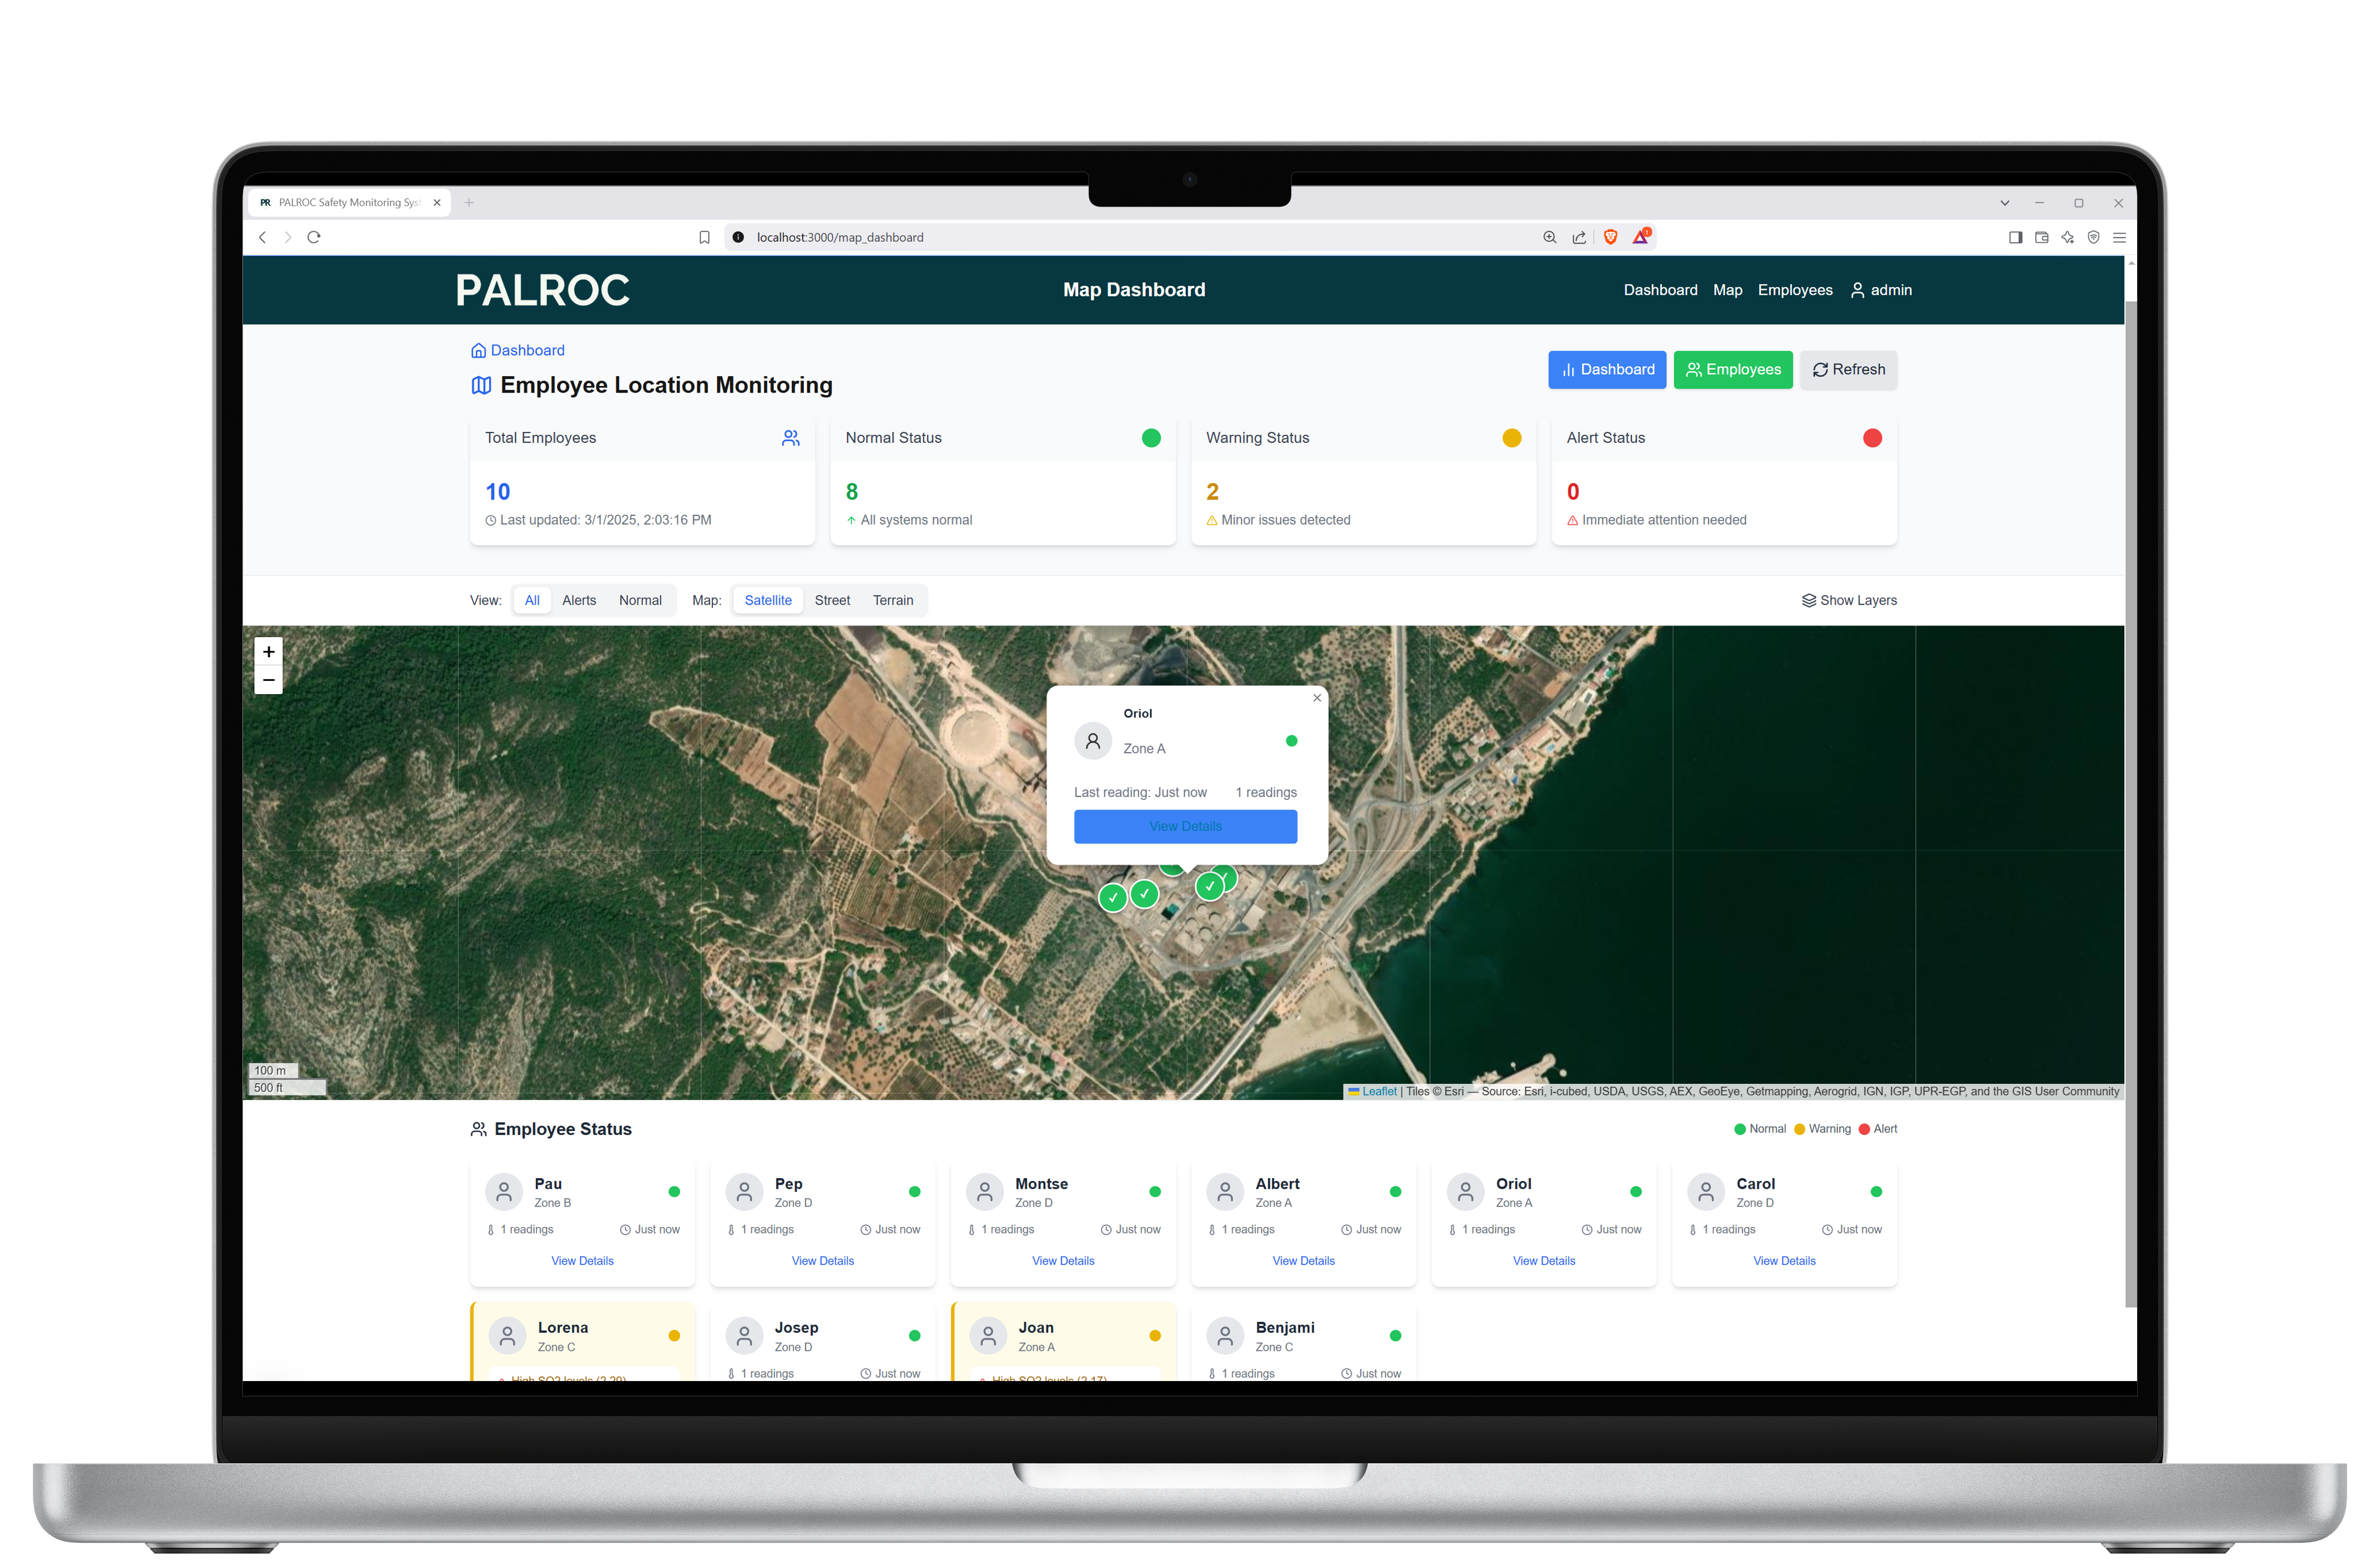
- Visualization: To make the data useful, a web-based dashboard and landing page were developed using Node.js. This interface consumed the APIs to plot sensor readings and device locations.
- DevOps: Implemented DevOps practices using Git for version control and Docker for containerization. The backend services (HiveMQ, TimescaleDB, Node.js) were deployed and tested on Oracle Cloud Infrastructure (OCI) for greater scalability.
Have a similar challenge?
Let's discuss how I can help bring your IoT product vision to life.
Start your project today
Ready to bring your electronics project to life? Let's discuss your requirements and explore how we can help you achieve your goals.
Send us a message
Free Initial Consultation
Not sure where to start? Schedule a 15-minute consultation to discuss your project requirements and get expert guidance.
Contact information
Phone
+34 711 23 20 51Office
Passeig Venta Nova, 10, Despacho 12, 43894 Camarles, Tarragona
Hours
Mon-Fri 9AM-6PM CET
Quick Response Guarantee
We respond to all project inquiries within 24 hours during business days. For urgent consultations, please call us directly.